Programming Platform
AI / ML
Manufacturer SPC
SPC dashboard monitors manufacturing processes with technology that measures and controls quality. SPC triggers various machines and instruments to provide quality data from product measurements and process readings.
Clean PNR data utility
SPC dashboard monitors manufacturing processes with technology that measures and controls quality. SPC triggers various machines and instruments to provide quality data from product measurements and process readings.
Statistical process control data is collected in two ways: first as measurements of a particular product and second as process instrumentation readings.

Quality control Analysis
Pareto charts
These are bar graphs that represent time and money or frequency and cost. Pareto charts are particularly useful to measure problem frequency. They show the 80/20 Pareto principle: addressing 20 percent of the processes will resolve 80 percent of the problems.
Stratification
This is a tool to separate data that simplifies pattern identification. Stratification is a process that sorts objects, people, and related data into layers or specific groups. It is perfect for data from different sources.
Control charts
These are the oldest, most popular statistical process tools

How does it work ?
Click on buttons in the `Parameter` column to visualize details of the trendline on the bottom panel.
Click the `Start` button, trends are updated every two seconds to simulate real-time measurements. The Sparkline on top panel and Control chart on bottom panel show Shewhart process control using mock data. Data falling outside of control limit are signals indicating 'Out of Control(OOC)', and will
trigger alerts instantly for a detailed checkup.
Operators may stop measurement by clicking the `Stop` button, and edit specification parameters for selected process lines(metrics) in Specification Tab.
Clean PNR data utility
SPC dashboard monitors manufacturing processes with technology that measures and controls quality. SPC triggers various machines and instruments to provide quality data from product measurements and process readings.
Statistical process control data is collected in two ways: first as measurements of a particular product and second as process instrumentation readings.
Quality control Analysis
Pareto charts
These are bar graphs that represent time and money or frequency and cost. Pareto charts are particularly useful to measure problem frequency. They show the 80/20 Pareto principle: addressing 20 percent of the processes will resolve 80 percent of the problems.
Stratification
This is a tool to separate data that simplifies pattern identification. Stratification is a process that sorts objects, people, and related data into layers or specific groups. It is perfect for data from different sources.
Control charts
These are the oldest, most popular statistical process tools
How does it work ?
Click on buttons in the `Parameter` column to visualize details of the trendline on the bottom panel.
Click the `Start` button, trends are updated every two seconds to simulate real-time measurements. The Sparkline on top panel and Control chart on bottom panel show Shewhart process control using mock data. Data falling outside of control limit are signals indicating 'Out of Control(OOC)', and will
trigger alerts instantly for a detailed checkup.
Operators may stop measurement by clicking the `Stop` button, and edit specification parameters for selected process lines(metrics) in Specification Tab.
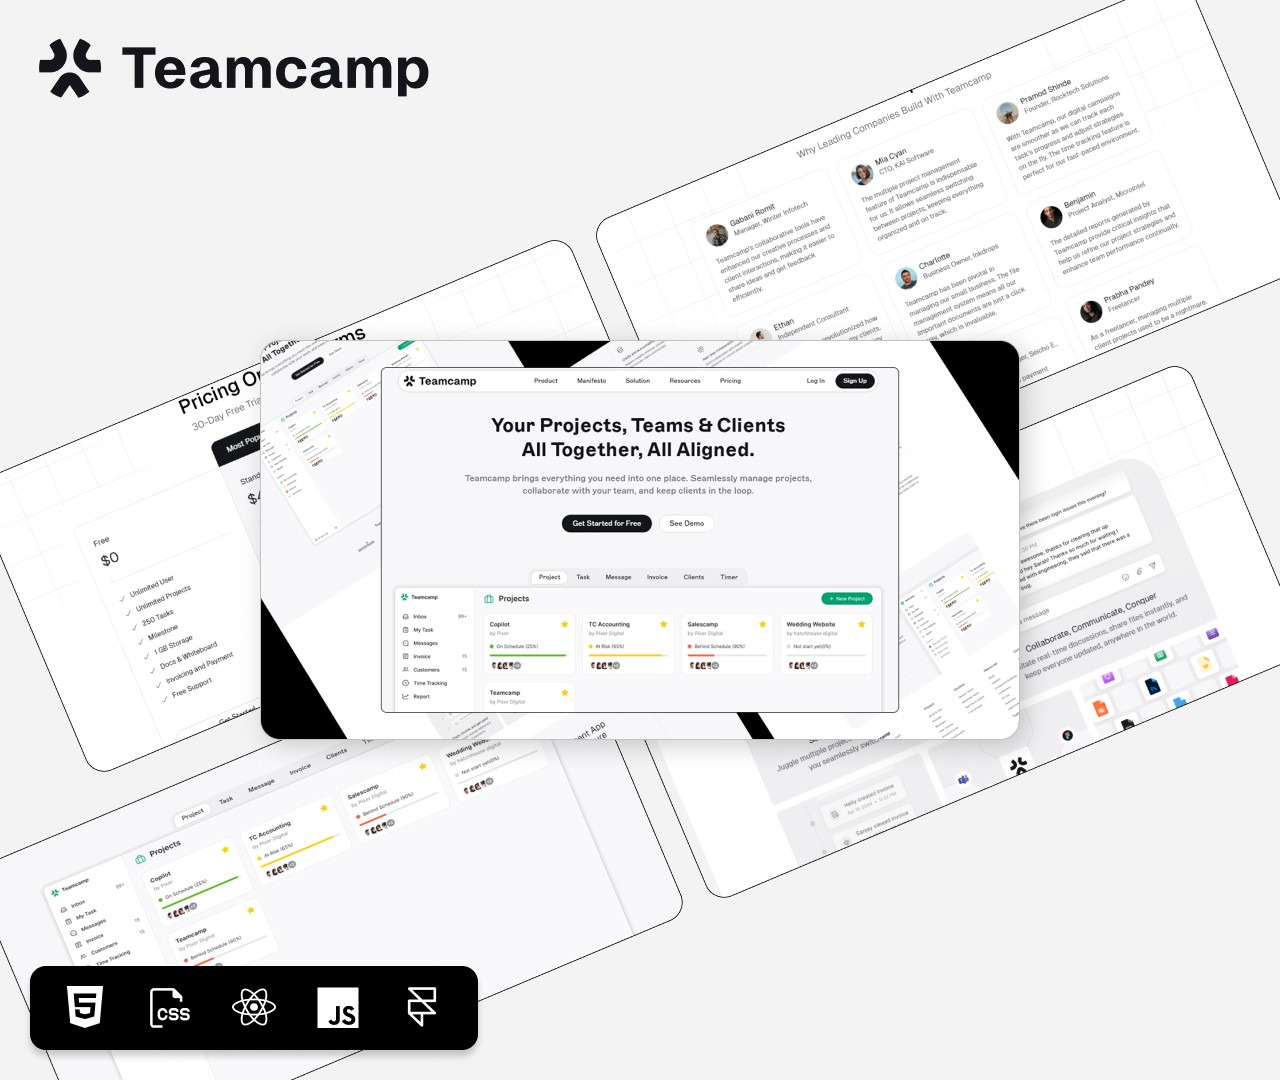
Technologies We Expertise In
Technologies We Expertise In
Technologies We Expertise In
Explore the cutting-edge tools and technologies we use to create seamless UI/UX designs. At Redslash, we deliver top-notch user experiences with the latest industry-leading technologies.
Explore the cutting-edge tools and technologies we use to create seamless UI/UX designs. At Redslash, we deliver top-notch user experiences with the latest industry-leading technologies.


Other Work
Share Your Powerful Vision
Let's create your next Big project together
Connect with us
info@redslash.tech
call
92740 50059
location_on
Silver Trade Center, Digital Valley, VIP Circle, Uttran, Surat, Gujarat, India
© 2024 Redslash Tech
Share Your Powerful Vision
Let's create your next Big project together
Connect with us
info@redslash.tech
call
92740 50059
location_on
Silver Trade Center, Digital Valley, VIP Circle, Uttran, Surat, Gujarat, India
© 2024 Redslash Tech
Share Your Powerful Vision
Let's create your next
Big project together
Connect with us
info@redslash.tech
call
72290 89082
location_on
521 Silver Trade Center, Digital Valley, VIP Circle, Uttran, Surat, Gujarat, India
© 2024 Redslash Tech
Share Your Powerful Vision
Let's create your next Big project together
Connect with us
info@redslash.tech
call
92740 50059
location_on
Silver Trade Center, Digital Valley, VIP Circle, Uttran, Surat, Gujarat, India
© 2024 Redslash Tech